What an Elevation Profile Is
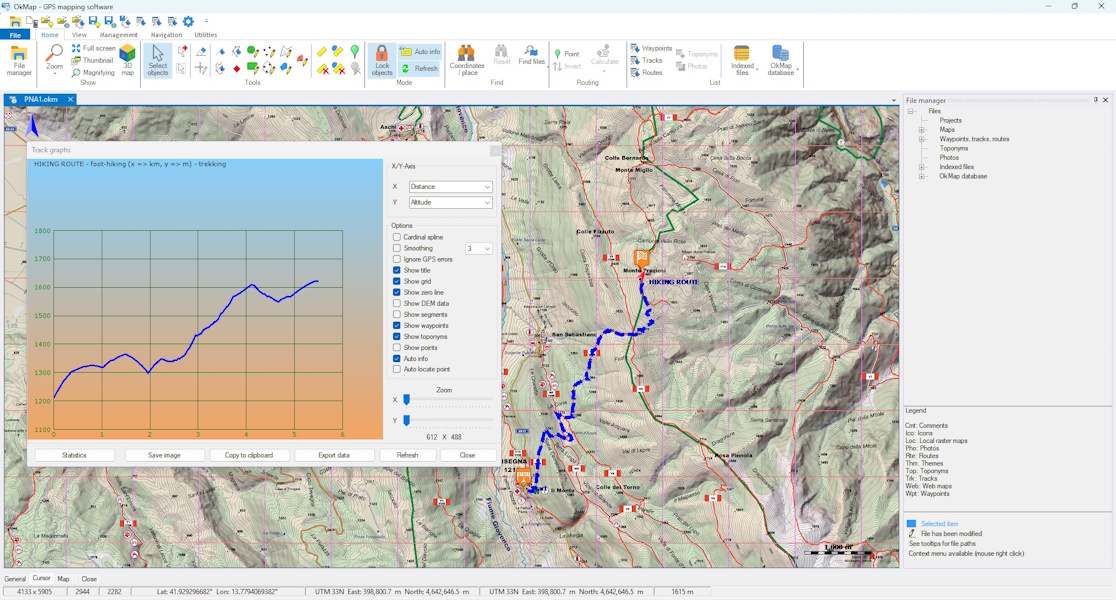
The elevation profile graphically represents the variation in elevation along a GPS track. The distance travelled is normally shown on the horizontal axis, while the elevation is represented on the vertical axis. Each point on the graph therefore corresponds to a position on the track and its associated elevation.
The shape of the profile makes it possible to immediately identify the main sections of the route: an ascending line indicates a climb, a descending line indicates a descent, while an almost horizontal section indicates an area with limited elevation changes.
The profile also makes it possible to identify the minimum elevation and the maximum elevation, observe the distribution of climbs and descents and identify the sections with the greatest changes in slope.
Minimum Elevation, Maximum Elevation and Elevation Gain
The minimum elevation indicates the lowest point reached by the route, while the maximum elevation represents the highest point. The difference between these two elevations indicates the elevation range between the two extremes, but does not necessarily coincide with the positive elevation gain of the route.
The positive elevation gain is in fact the sum of the elevation changes along uphill sections, while the negative elevation change represents the sum of the elevation changes along downhill sections. The elevation gain value can also depend on the method used to process the elevations of the GPS track. To learn more about this aspect, see the article GPS Tracks: how is elevation gain calculated?
Slope and Route Difficulty
Analyzing climbs and descents allows evaluation of the physical difficulty of a route.
Steep slopes and concentrated elevation gains over short distances generally require greater effort during outdoor activities.
Elevation Correction with DEMs
The elevations contained in GPX files can be affected by the characteristics of the GPS receiver and by errors in the elevation measurement. To obtain a profile that is more consistent with the terrain, it is possible to use a DEM (Digital Elevation Model) as an alternative source of elevations.
OkMap can use the available DEM data to associate each track point with an elevation derived from the terrain model. This makes it possible to display and analyze the elevation profile using a different elevation source from the one originally contained in the GPX file.
The quality of the result depends on the resolution and coverage of the DEM used. OkMap supports several types of elevation data, including SRTM, GeoTIFF and ASCII Grid. For a comparison of the main datasets and to choose the most suitable one for different situations, see the article SRTM, Copernicus and other DEMs: which one should you choose?.
Elevation Analysis with OkMap
OkMap provides tools for analyzing the elevation profile of a GPS track and displaying the variation in elevation along the route. The profile makes it possible to quickly identify climbs, descents and changes in slope, as well as providing information about the minimum and maximum elevations and the overall elevation gain.
Elevation information can be derived from the elevations contained in the GPX track or, when available, from data provided by a DEM. This makes it possible to compare or use different elevation sources when analyzing the route.
The positive elevation gain depends on how elevation changes along the track are processed. For this reason, different results between software applications do not necessarily indicate an error: they may result from different methods of processing the elevations. To learn more about this issue and the approach adopted by OkMap, see the article GPS Tracks: how is elevation gain calculated?.