Why Are Map Projections Necessary?
Have you ever tried to lay an orange peel flat on a table without tearing it? It's impossible. The peel bends, tears, or forms wrinkles. The very same problem arises whenever we try to represent the Earth on a flat surface.
No matter how carefully you try, the peel can never be flattened completely without tearing, folding, or becoming distorted. This is because the surface of an orange is curved, whereas the table is perfectly flat.
Exactly the same thing happens with the Earth.
Our planet has a curved surface, while a map or a computer screen is flat. To represent the world on a map, it is therefore necessary to apply a mathematical transformation that converts the Earth's surface into a two-dimensional representation.
This transformation is called a map projection.
There is no perfect map projection. Every projection is a compromise: it can preserve certain properties of the Earth's surface, but it will inevitably distort others.
What Is a Map Projection?
A map projection is a set of mathematical rules that makes it possible to transform the position of points on the Earth's surface into coordinates that can be used on a flat surface, such as a paper map or a computer screen.
Every point on the Earth is represented on the map using precise mathematical formulas. The result is a continuous and consistent representation of the territory, essential for drawing maps, planning routes, and displaying geographic data.
Coordinates always describe the same location on the Earth: only the way that location is represented on the map changes.
This transformation changes more than just the Earth's shape: it also changes how distances, areas, directions, and angles are represented. For this reason, choosing the right projection is one of the most important aspects of cartography.
Map projections are used almost everywhere: in GPS navigators, topographic maps, online services such as Google Maps and OpenStreetMap, GIS applications, and software such as OkMap.
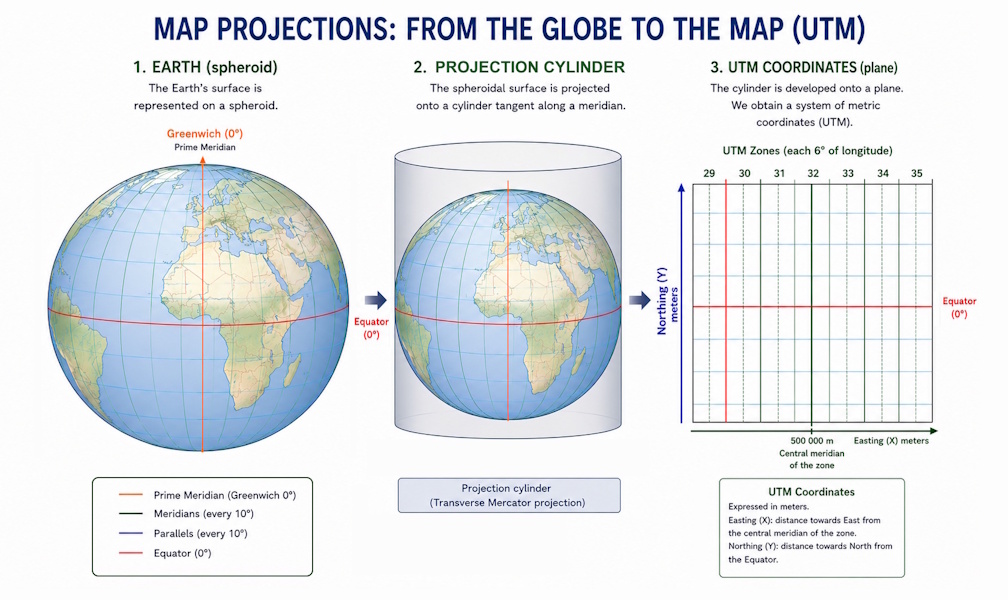
A map projection defines how the Earth's surface is transformed into a flat representation. A coordinate system, on the other hand, defines how to numerically identify every point on the map. The two concepts are closely related, but they are not the same. For example, the UTM coordinate system uses the Transverse Mercator projection, adding the division into zones and the rules for expressing coordinates in meters.
Why Does Every Projection Introduce Distortion?
It may seem natural to ask why there isn't simply a "perfect" projection capable of representing the Earth without any errors.
The reason is purely geometric: a curved surface cannot be transformed into a flat plane while preserving all of its properties at the same time. This is a mathematical limitation, not a limitation of technology or measurement accuracy.
Every projection must therefore choose which characteristics to preserve most accurately and which ones to allow to be distorted. Some preserve angles faithfully, others preserve areas, and others preserve specific distances or directions.
As a result, there is no universally "best" projection. There is only the projection that is best suited to the purpose for which the map is created.
Example. On Mercator maps, Greenland appears enormous. Many people believe it is roughly the same size as Africa. In reality, Africa is about fourteen times larger. Greenland appears so large only because the projection progressively enlarges areas closer to the poles.
Whenever you look at a map, remember that no map represents the Earth perfectly. Every map is the result of a compromise between the properties that can be preserved and those that must inevitably be distorted.
What Properties Can Be Preserved?
Since it is impossible to preserve everything simultaneously, every projection is designed to prioritize certain characteristics over others. The four most important properties are the following.
| Property | What It Preserves | Typical Applications |
|---|---|---|
| Angles | Local shapes and the angles between lines. | Navigation, topographic maps. |
| Areas | The true area of regions. | Thematic and statistical maps. |
| Distances | Distances along specific directions or lines. | Some aeronautical and nautical charts. |
| Directions | Specific bearings relative to one or more points. | Navigation and specialized applications. |
In the next chapter, we will see how these different priorities have led to the development of numerous families of map projections, each designed to meet different requirements.
Preserving certain distances does not mean that every measurement made on a map corresponds exactly to the equivalent real-world distance on the Earth's surface. If you would like to learn more about this topic, read the article Why Map Distances Do Not Always Match Real-World Distances.
The Main Families of Map Projections
Over the centuries, cartographers have developed undreds of different map projections, each designed to solve specific representation problems.
The various projections can be grouped into several major families, depending on the geometric surface used to project the Earth.
| Family | Projection Surface | Typical Use |
|---|---|---|
| Cylindrical | A cylinder wrapped around the Earth. | World maps and online mapping services. |
| Conic | A cone placed over the Earth's surface. | Mid-latitude regions and large countries. |
| Azimuthal | A plane tangent to the Earth. | Polar regions and maps centered on a specific point. |
These surfaces should be thought of as geometric tools used to construct a map. In reality, there are no cylinders or cones surrounding the Earth: they are simply mathematical models that help transform a curved surface into a flat representation.
Cylindrical Projections
In cylindrical projections, the Earth's surface is represented as if it were projected onto a cylinder tangent or secant to the globe. After the projection, the cylinder is "unrolled" to produce a rectangular map.
Do not imagine a real cylinder or a real cone surrounding the Earth. They are geometric models used by mathematicians to construct map projections.
This family includes some of the best-known projections, such as the Mercator projection and the Web Mercator projection used by most online mapping services.
Distortion increases progressively as you move away from the equator, becoming very noticeable in the polar regions.
Conic Projections
Conic projections use a cone placed over the Earth. After the cone is unrolled onto a plane, the resulting maps are particularly accurate in the areas crossed by the standard parallel or standard parallels.
They are often used to represent continents or countries that extend primarily in an east-west direction, such as much of Europe and North America.
Azimuthal Projections
In azimuthal projections, the Earth's surface is projected directly onto a plane tangent to the globe at a specific point.
These projections are particularly effective for representing polar regions or limited areas around the point of tangency, where distortion remains relatively low.
The classification into cylindrical, conic, and azimuthal projections describes the geometric method used to construct the map. It does not indicate how accurate a projection is: each family includes numerous variants, each designed to meet different requirements.
Conformal, Equal-Area, Equidistant, and Compromise Projections
In addition to their geometric classification, map projections are also classified according to the property they preserve most effectively. In practice, this classification is the most important one when choosing which projection to use.
| Projection Type | Primarily Preserves | Accepts Distortion Of |
|---|---|---|
| Conformal | Angles and local shapes. | Areas and distances. |
| Equal-area | Areas. | Shapes and angles. |
| Equidistant | Certain distances. | Areas, shapes, or angles. |
| Compromise | No single property perfectly. | All properties are distributed with limited distortion. |
Compromise projections deserve a brief explanation. They do not attempt to preserve any single property perfectly. Instead, they distribute distortion in a balanced way. For this reason, they are often used for general-purpose maps.
The Main Map Projections and Reference Systems
Over the centuries, hundreds of map projections and numerous reference systems have been developed, each designed to meet specific needs. In practice, however, only a few have become widely used and are now employed in GPS devices, mapping software, and online map services.
Understanding their main characteristics helps explain why the same geographic location can be represented in different ways and why each solution has its own advantages and limitations.
The Mercator Projection
Created in 1569 by the Flemish cartographer Gerardus Mercator, it is probably the most famous map projection in history. It is a conformal projection: it correctly preserves local angles and shapes, a characteristic that made it an essential tool for maritime navigation for centuries.
Its main limitation is the significant distortion of areas at high latitudes. As you move closer to the poles, continents and islands appear progressively larger than they actually are.
A well-known example is Greenland, which on traditional Mercator maps appears to be comparable in size to Africa. In reality, Africa is about fourteen times larger.
Web Mercator
Whenever you use Google Maps, OpenStreetMap, Bing Maps, or many other online mapping services, you are almost certainly viewing a map created using the Web Mercator projection.
Web Mercator is derived from the traditional Mercator projection, but it uses the WGS84 datum and a simplified mathematical formulation that allows tiled maps to be managed very efficiently. This approach makes it possible to load map tiles quickly while zooming and panning.
The widespread adoption of Web Mercator is not due to its absolute accuracy, but to the simplicity with which it enables the creation and distribution of digital maps on a global scale.
Web Mercator is excellent for displaying maps on screen, but it was not designed for making accurate distance or area measurements over large geographic regions.
For this very reason, distances measured directly on the map may differ from the corresponding real-world distances on the Earth's surface. If you would like to learn more about this topic, read the article Why Map Distances Do Not Always Match Real-World Distances.
Transverse Mercator
The Transverse Mercator is a conformal map projection derived from the Mercator projection. Unlike the latter, the projection cylinder is oriented along a meridian rather than along the equator.
This configuration significantly reduces distortion in the vicinity of the central meridian, making it particularly suitable for mapping territories that extend predominantly in a north-south direction.
For this reason, the Transverse Mercator projection forms the basis of many modern mapping systems, including the UTM coordinate system and, historically, the Italian Gauss-Boaga coordinate system.
UTM (Universal Transverse Mercator)
The UTM system deserves special attention because it is often mistaken for a simple map projection.
In reality, UTM is a coordinate system based on the Transverse Mercator projection. The Earth's surface is divided into 60 zones, each 6 degrees of longitude wide, and each zone uses its own projection to minimize distortion.
This subdivision provides highly accurate metric coordinates and makes UTM one of the most widely used systems in technical cartography, topographic surveying, hiking, and GPS receivers.
Before the widespread adoption of the UTM system, the Gauss-Boaga coordinate system was widely used in Italy. It is based on the Transverse Mercator projection and the Roma40 geodetic datum. Even today, many historical and technical cartographic datasets are distributed or georeferenced using this system.
If you work with historical Italian cartography or need to georeference cadastral or IGM maps, you can learn more in the article Italian cartography: Gauss-Boaga, Roma40, ED50 and Cassini-Soldner coordinate systems .
It is precisely because each zone covers a limited area that distortion remains low, allowing highly accurate distance measurements and cartographic calculations.
A hiker crossing the boundary between two zones naturally remains at the same location on Earth, but the UTM coordinates change.
Lambert Conformal Conic
The Lambert Conformal Conic projection is one of the most widely used conic projections. It preserves angles and local shapes over small areas and is particularly well suited for representing regions that extend mainly in an east-west direction.
For this reason, it is used by many national mapping agencies and cartographic organizations, especially in mid-latitude regions.
Mercator, Web Mercator, UTM, and Lambert are not "competing projections." They are tools designed for different purposes: navigation, online maps, metric coordinates, and national cartography.
Recommended solution
There is no single answer that fits every situation. The choice of projection depends on the type of work to be carried out, the size of the area to be represented, and the property you want to preserve.
| Goal | Recommended Projection | Reason |
|---|---|---|
| Displaying online maps | Web Mercator | Compatible with the major online mapping services. |
| Navigation | Mercator | Preserves local angles and directions. |
| Surveying and metric coordinates | UTM | Uses the Transverse Mercator projection and reduces distortion within each zone. |
| National cartography | Lambert Conformal Conic | Highly accurate at mid-latitudes. |
Mapping software such as OkMap automatically handles a wide range of coordinate reference systems and map projections, allowing you to work with data from different sources without having to deal with the complex mathematical calculations that make these transformations possible.
Why Does Google Maps Use Web Mercator?
At this point, you might wonder: if Web Mercator introduces distortion, why is it used by Google Maps, OpenStreetMap, Bing Maps, and most other online mapping services?
The answer is simple: because it offers an excellent compromise between simplicity, speed, and compatibility.
Web Mercator makes it possible to divide the Earth's entire surface into millions of small square tiles. Each zoom level uses tiles of the same size, which can be loaded quickly only when needed.
Thanks to this approach, you can pan and zoom smoothly without having to download the entire world map every time. This is one of the main reasons for the success of modern online mapping services.
For many applications, the accuracy provided by Web Mercator is more than sufficient. When accurate geodetic measurements are required, it is preferable to use coordinate systems and algorithms specifically designed for that purpose.
Google Maps was not designed to be a school atlas, but a fast and convenient mapping tool.
Displaying a map and measuring the Earth's surface are two different tasks. A projection that is ideal for displaying maps quickly on a screen is not necessarily the best choice for making accurate measurements.
Map Projections in OkMap
OkMap supports a wide variety of coordinate reference systems and map projections, allowing you to import, display, and process data from different sources without having to perform complex coordinate transformations manually.
The software uses the information contained in coordinate reference systems (CRSs) and their associated EPSG codes to automatically transform coordinates, raster maps, GPX tracks, waypoints, and other geographic data while maintaining consistency across different formats. For example, EPSG:4326 identifies the WGS84 geographic coordinate system, while EPSG:3857 identifies the Web Mercator projection used by most online maps.
This makes it possible, for example, to overlay a georeferenced map, a GPS track recorded in the field, and data from online mapping services, even when they use different coordinate reference systems.
Understanding the role of map projections helps you interpret these results correctly and choose, whenever necessary, the coordinate reference system that best suits your work.
GPS coordinates indicate WHERE a point is located. A map projection determines HOW that point is represented on the map.