What is a topographic map
A topographic map is a representation of the terrain created according to a specific scale and using conventional symbols.
Unlike a simple road map, a topographic map also aims to represent the shape of the terrain, through contour lines and elevations, as well as the natural and artificial features present on the terrain.
A topographic map can therefore answer several questions: where a particular point is located, how far apart two locations are, which route can be followed and how elevation changes across the terrain.
The legend and symbology
The legend explains the meaning of the symbols used on the map. It is the first element to consult when using a map that you are not familiar with.
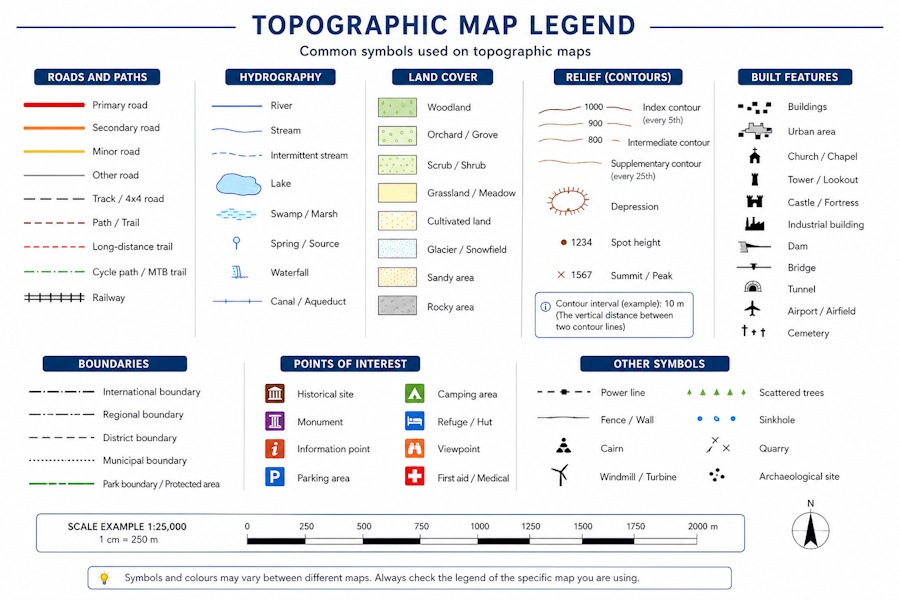
Symbols can represent both natural features and man-made features. These may include, for example:
- roads, tracks and trails;
- buildings and built-up areas;
- watercourses, lakes and other wetland areas;
- forests, meadows, pastures and cultivated land;
- rocks, cliffs and other terrain features;
- borders and infrastructure;
- points of interest and other cartographic features.
Symbology may vary between different maps, especially when they come from different agencies or producers. For this reason, it is always important to consult the specific legend of the map being used.
Map age and updating
When using a topographic map, it is also important to consider its production and update date. A map does not necessarily represent the current situation of the terrain, but rather the situation surveyed at the time it was created or last updated.
This aspect is particularly important for hiking activities. Roads, trails, buildings, wooded areas, crops and other terrain features can change over time, while a dated map may continue to show a situation that no longer corresponds to reality.
Even a highly detailed topographic map should therefore not automatically be considered up to date. Before using it, it is always advisable to check, when available, the year of production and the year of the latest update.
Map scale
The scale indicates the ratio between a distance measured on the map and the corresponding distance on the ground. It is normally expressed as a ratio, for example 1:25,000.
A 1:25,000 scale map means that one unit of measurement on the map corresponds to 25,000 units of the same measurement on the ground.
For example, 1 cm on the map corresponds to 25,000 cm in reality, or 250 meters. Therefore, 4 cm on the map correspond to 1 km on the ground.
Some common examples are:
- 1:10,000 → 1 cm on the map = 100 m on the ground
- 1:25,000 → 1 cm on the map = 250 m on the ground
- 1:50,000 → 1 cm on the map = 500 m on the ground
- 1:100,000 → 1 cm on the map = 1 km on the ground
It is important not to confuse the concept of scale with that of detail. The smaller the denominator, the larger the scale and, for the same represented area, the greater the detail generally available. A 1:25,000 map, for example, normally shows more detail than a 1:50,000 map.
Grids and coordinates
Topographic maps generally show one or more grids that make it possible to determine the position of the points represented.
Depending on the map, there may be geographic coordinates expressed as latitude and longitude or coordinates belonging to a projected system, such as UTM metric coordinates.
It is also important to remember that a distance measured on the map or derived from projected coordinates does not necessarily coincide with the actual distance on the ground. The difference depends on the projection system used and on the distortions introduced by the representation of the Earth's surface. To learn more about this topic, see the article Why distances on the map do not always match real distances.
The grid makes it possible to read a position with greater precision than simply observing the map visually. To use coordinates correctly, however, it is necessary to know the reference system adopted by the map.
To learn more about latitude, longitude, UTM, WGS84 and EPSG, see the article GPS coordinates explained: latitude, longitude, UTM, WGS84 and EPSG.
Georeferencing an image map also requires a correct interpretation of the coordinate system. To learn more about the practical procedure, see the article Practical procedure for assigning geographic coordinates to an image map.
Contour lines
Contour lines, or isohypses, are lines connecting points with the same elevation. They are one of the most important tools for understanding the three-dimensional shape of the terrain represented on a two-dimensional map.
The difference in elevation between two consecutive contour lines is called the contour interval. If, for example, the contour interval is 10 meters, moving from one contour line to the next the elevation changes by 10 meters.
Contour lines can be represented using different styles. Some may be more prominent and show the elevation value, while others may be intermediate. It is therefore important to use the map legend to interpret them correctly.
The distance between contour lines also provides a qualitative indication of the slope: very closely spaced contour lines generally indicate a steep slope, while more widely spaced contour lines indicate a gentler slope.
To assess the slope correctly, however, it is also necessary to consider the contour interval and the map scale. The visual distance between contour lines alone is not sufficient to compare maps with different characteristics.
How to recognize the shape of the terrain
Contour lines do not only describe individual elevations: their configuration makes it possible to reconstruct the shape of the terrain.
By learning to recognize some recurring configurations, it is possible to identify the main forms of the landscape on the map.
- Summit or peak: generally represented by concentric closed contours with elevations increasing towards the center.
- Valley: the contour lines form characteristic patterns that make it possible to identify the direction of the valley and its relationship with the slope.
- Ridge: a crest line that generally separates two slopes and can be recognized from the arrangement of the contour lines and elevations.
- Saddle: a relatively low area between two elevated areas, often associated with passes or mountain crossings.
- Basin or depression: a closed area in which the elevation decreases towards the center; some maps use specific symbols to highlight it.
- Slope: the distance between contour lines makes it possible to assess qualitatively how steep or gentle it is.
The shape of the contour lines should be interpreted together with the elevations shown on the map and the other elements of the cartographic representation. In this way it is possible to obtain a much more realistic mental representation of the terrain.
Elevations and spot heights
In addition to contour lines, topographic maps may show spot heights, that is, points to which an elevation value is explicitly assigned.
Spot heights are particularly useful for knowing the elevation of significant features with precision, such as peaks, passes, intersections or other characteristic points of the terrain.
The elevations of spot heights and those of contour lines should be interpreted together. The former provide point values, while the latter make it possible to understand how elevation varies across space.
Orientation and direction
To use a map correctly, it is important to know how to orient it in relation to the terrain. A topographic map normally indicates North and may contain information useful for distinguishing geographic north from other references used for orientation.
Orienting the map makes it easier to compare the features represented with what can be observed on the ground. It is also the first step in using a map, compass and GPS together.
The combined use of a map and GPS to determine your position, follow a direction and check the route is explained in the article How to navigate with a map and GPS.
Measuring distances and routes on the map
The scale makes it possible to convert a measurement made on the map into the corresponding distance on the ground. For a straight-line distance, simply use a ruler and apply the ratio indicated by the scale.
For winding routes, such as mountain trails and roads, the measurement can be made by following the route with a curvimeter or by dividing it into several segments.
The result obtained from the map should nevertheless be considered a measurement of the distance represented by the cartography. The actual distance traveled may differ, for example, due to the accuracy of the map and the actual geometry of the route.
In mapping software, many of these operations can be performed automatically, using the coordinates of the represented features directly.
From paper maps to digital tools
Many operations that once required manual tools can now be performed directly with mapping software.
The ruler can be replaced by distance measurement tools, the curvimeter by automatic measurement of a track or route, while coordinates and grids can be used directly through digital tools.
Terrain analysis can also be enhanced with functions that are not easily available on a paper map, such as generating an elevation profile, calculating elevation gain or analyzing elevations along a GPS track.
OkMap allows these functions to be combined with raster maps, vector maps, Web maps and GPS data, keeping together the cartographic representation and the information related to the route.
To learn more about the differences between the main types of maps, also see the article Raster or vector maps: which one should you choose?.
To learn more about using a topographic map in the field and comparing it with your GPS position, also see the article How to orient yourself with a map and GPS.